Visual debugging is a huge boost to productivity. The Go Delve debugger provies a nice command line interface for this, and integrates nicely with VS Code integration.
I have recently been working on the external-dns K8s SIG project, and found the debugging experience very useful when writing tests.
Getting started
Install Go Delve following the instructions on GitHub (this is a simple go get command).
Debugging tests
My recent example was debugging the cloudflare provider in external-dns. To start debugging, it’s as simple as running this command:
1 | dlv test sigs.k8s.io/external-dns/provider/cloudflare |
This will cause the debugger to:
- Build the application in a way suitable for debugging
- Attach the debugger to the running program
If you need to debug the application itself (say from the root directory that contains the main package), you can run dlv debug.
Setting breakpoints
At this point, we are debugging the tests. We are able to give CLI subcommands directly to the delve debugger.
To debug a specific test, we need to set a breakpoint on that test function.
First, we can discover our test functions with the following command:
1 | (dlv) funcs.Cloudflare.Test* |
This provides a list of tests like so:
1 | sigs.k8s.io/external-dns/provider/cloudflare.TestCloudFlareZonesWithIDFilter |
We can then set a breakpoint on a specific test:
1 | (dlv) break TestCloudflareComplexUpdate |
We can then run continue, and the debugger will jump to that breakpoint:
1 | 1106: |
If you have a specific source code line you would like to set a breakpoint on, you can set it like so:
1 | (dlv) break mybreakpoint cloudflare_test.go:1145 |
Inspecting locals
To print all local variables:
1 | (dlv) locals |
To print a specific local, you can use the print (p) command:
1 | p planned |
Navigating through the code
The following commands are useful:
next- steps over to the next source code line (this won’t step into functions)step- single step to the next line of code to be run (this will step into functions)continue- runs to the next breakpoint (or program termination)stepout- steps out of the current function
There’s a lot more
You can run the help subcommand to discover the full list of supported operations. The commands I’ve mentioned here are only the basics.
VS Code integration
An even more visual experience is possible using the Go extension for VS Code, which integrates with the Delve debugger.
I had to set my .vscode/launch.json like this (with program pointing to the directory that contains the tests I’m intersted in):
1 | { |
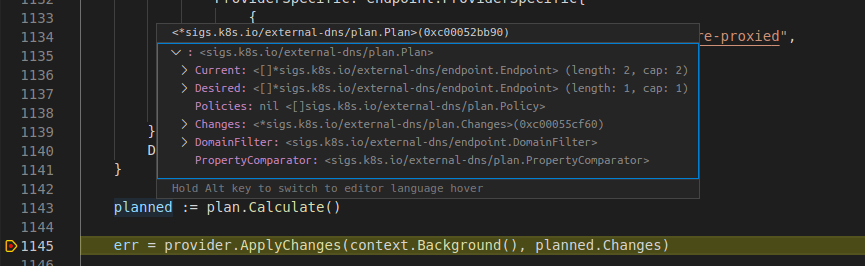
I was then able to set a breakpoint and hit the play button in the debug extension in the side menu.
It’s a nice experience - you can see the breakpoint being hit and inspect locals by hovering over them:
For more information, have a look at Delve on GitHub.